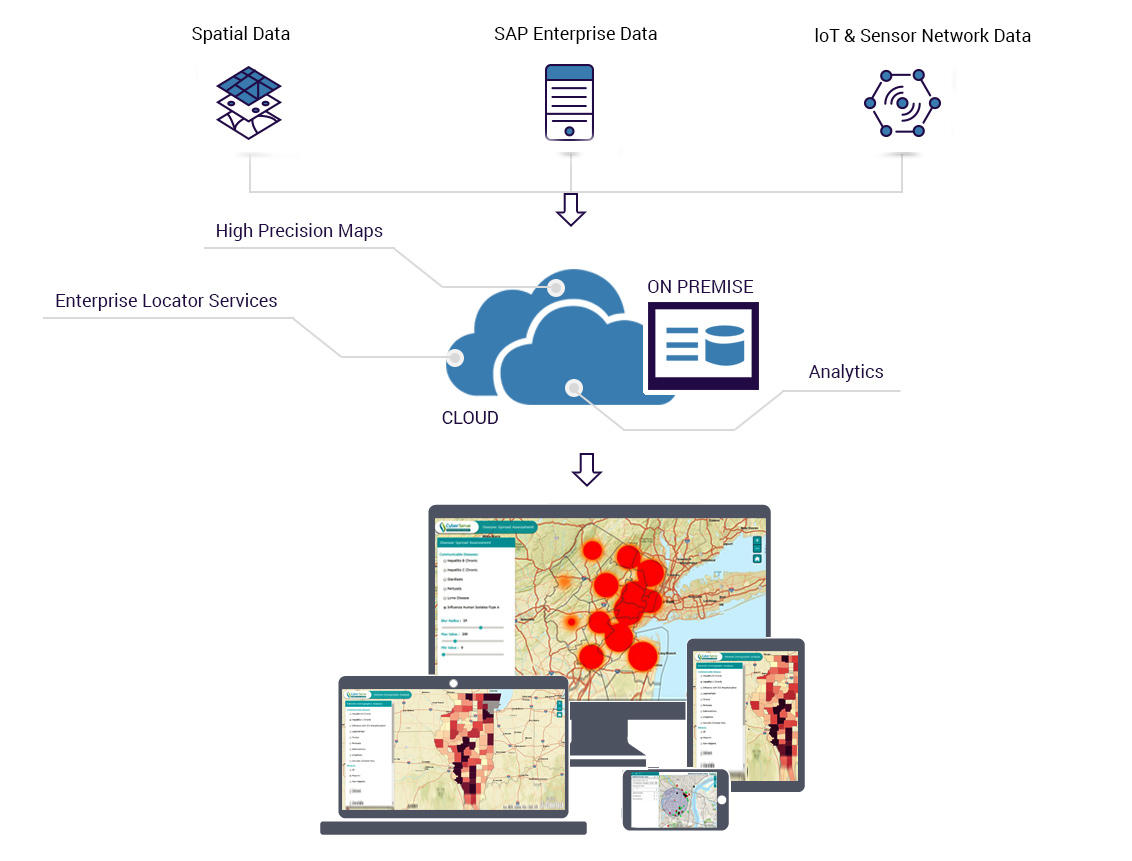
We are surrounded by data. Both governments and private organizations collect and manage volumes of data in a variety of systems within various departments. The ability to access and share actionable data across departments and the enterprise is often difficult. That’s why organizations are increasingly transforming their operations by interconnecting and integrating their departmental information systems and data repositories. Geospatial technologies are one of the fundamental ways to enable this digital integration. This integration enables access to data and analysis with geospatial context for greater insight, understanding, and decision support. By bringing the IT and geographic information system (GIS) capabilities together, you provide greater access to your data for your entire workforce.
Data is critical for long-range planning, asset management, public safety, citizen engagement, and response to requests. GIS, well-known for its powerful mapping, visualization, and analytics capabilities, has emerged as a powerful IT platform for helping organizations integrate data to support their primary mission. Data integrated with GIS is quickly transformed into actionable information.
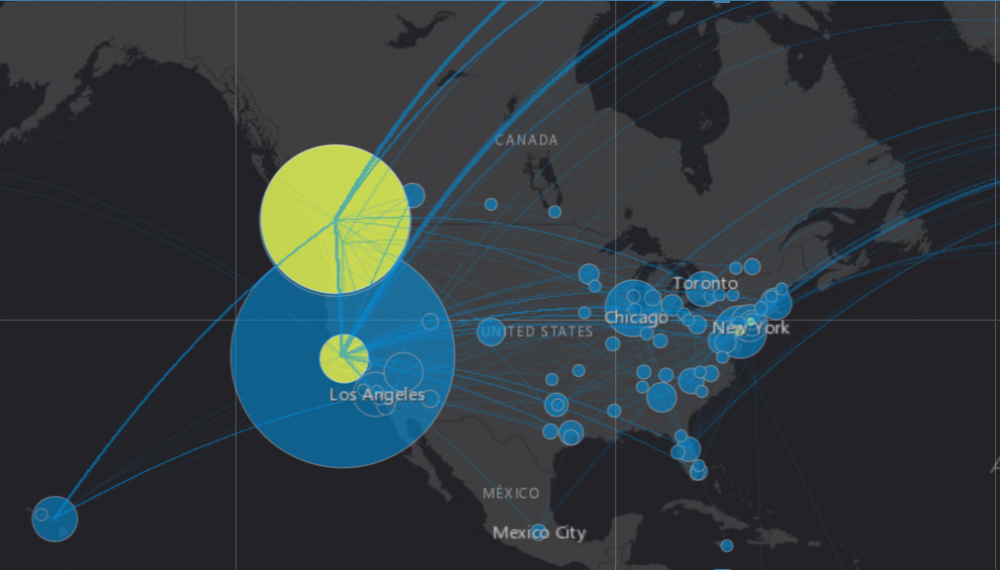
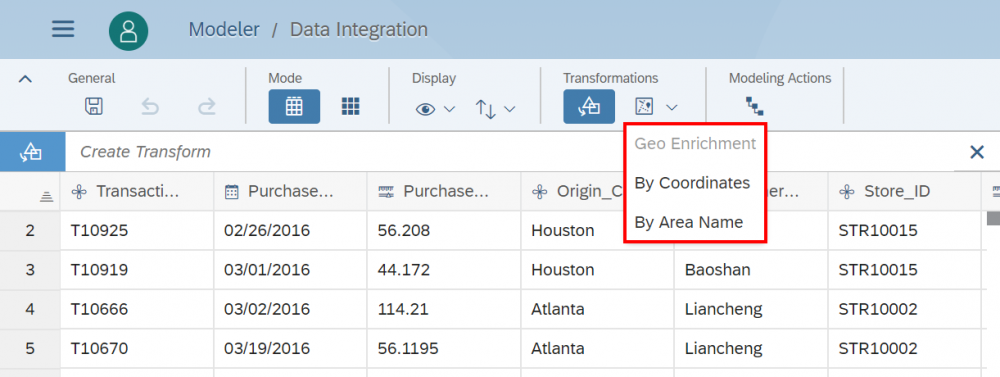
Maps are essential for any businesses that are spread across multiple geographies to perform visual Geospatial Analysis. Geo-Location dimensions are SAP featured actions that turn your raw data’s location coordinates into an enriched format to be used in the Story/ Analytics Designer. This step is a mandate for spatial analysis and can be easily modelled while importing acquired connections.
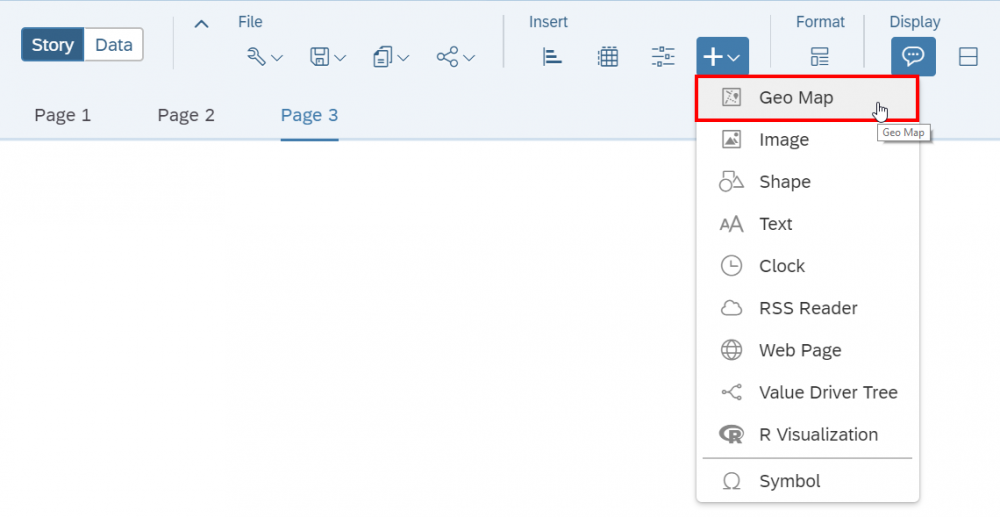
Geo maps can add a lot of value and context to your data analysis. SAP Analytics Cloud offers a variety of geographical mapping options to display your regional data, trends, flow, and more. Geo maps are actually created in Modeler using location data. About Modeler in short – Data modeling in SAP Analytics Cloud is a way to enhance your data and prepare it for analysis. You can bulk edit your data, define categories and set hierarchical relationships, and create custom formulas. SAP Analytics Cloud’s business intelligence function has two main components:
– Models
– Stories
Models are where you do all your data modeling in preparation for analysis. Data modeling entails data wrangling, or cleaning, your dataset, defining your measures and dimensions, and enhancing your data by establishing hierarchies, setting units and currencies, and adding formulas.
Stories, on the other hand, are where your data comes to life. In Story mode, you can visualize your data with charts and graphs, giving you an entirely new way to look at your data and gain valuable insight about your business.
Organizations that combine geospatial and enterprise data have a clear competitive advantage in differentiation — they have better insights, they make better business decisions and are more innovative.
Simply, location-enabled data results in a more intelligent enterprise.
For more information, please contact us – https://alfatec.hr/en/contact/!